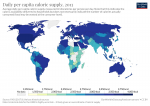
One of the most basic measures of food supply and security is the amount of calories available per person.
This does not give a complete picture of nutrition – for a healthy diet we need much more than just energy. But as the most basic criteria of food security, getting enough calories is an important measure. It is used as input for the most important metrics used to assess global malnutrition: undernourishment.
At Our World in Data we have constructed a long-term series of per capita supply of calories, combining recent data for every country in the world with historical series for select countries where this data is available.
Here I detail the sources we use to construct this dataset, and provide an explanation of how this indicator is measured.
The script that produces this long-run dataset can be accessed in our GitHub repository.
We provide a full citation for each of the sources below. If you cite data for a specific period, please cite the original source. For example, for the period 1961 onwards, please cite the Food and Agriculture Organization of the United Nations. You can add “via Our World in Data” if you downloaded the data from us.
Pre-1961: multiple sources
United Kingdom
The pre-1961 series for the UK has been constructed from multiple sources. Note that all pre-1961 sources represent the daily supply for England: we adopt this figure for the UK as a whole.
From 1273 to 1750: the data is sourced from the work of Broadberry et al. (2015): British Economic Growth, 1270–1870.
Full citation: Broadberry, S., Campbell, B., Klein, A., Overton, M., & Van Leeuwen, B. (2015). British Economic Growth, 1270–1870. Cambridge: Cambridge University Press. doi:10.1017/CBO9781107707603.
From 1800 to 1940: data is sourced from Floud, Fogel, Harris, and Hong (2011)’s book ‘The Changing Body: Health, Nutrition, and Human Development in the Western World Since 1700’.
The data is sourced from Table 5.5 ‘Daily calorie consumption per head in Western Europe, 1800–1960’ in this publication.
Full citation: Floud, R., Fogel, R. W., Harris, B., & Hong, S. C. (2011). The changing body: Health, nutrition, and human development in the western world since 1700. Cambridge University Press.
Belgium, Finland, Germany, Iceland, Italy, the Netherlands and Norway
Researchers Floud, Fogel, Harris, and Hong have reconstructed long-run consumption patterns for Western Europe. They detail these figures in their book ‘The Changing Body: Health, Nutrition, and Human Development in the Western World Since 1700’.
The data used for these countries for the years between 1800 and 1960 is sourced from Table 5.5 ‘Daily calorie consumption per head in western Europe, 1800–1960’ in this publication.
Full citation: Floud, R., Fogel, R. W., Harris, B., & Hong, S. C. (2011). The changing body: Health, nutrition, and human development in the western world since 1700. Cambridge University Press.
France
Data for France is sourced from exactly the same source listed above (Floud et al. (2011)), which one additional data point for 1705.
This point is sourced from Robert Fogel’s book: ‘The Escape from Hunger and Premature Death, 1700–2100’. You find this in Table 1.2.
Full citation: Fogel, R. W. (2004). The escape from hunger and premature death, 1700-2100: Europe, America, and the Third World (Vol. 38). Cambridge University Press.
United States
All pre-1961 data for the United States is also sourced from the work of Floud et al. (2011). It is provided in Table 6.6 of ‘The Changing Body: Health, Nutrition, and Human Development in the Western World Since 1700’.
Sub-Saharan Africa, Kenya, Uganda, South Asia, Cambodia, China, India, Brazil, Mexico and Peru
Data points for the years 1934 and 1946 are sourced from an earlier document published by the UN FAO (2000).
Full citation: FAO (2000) – The State of Food and Agriculture: Lessons from the Past 50 Years. Food and Agriculture Organization. Available here.
All countries with data in 1948 and 1949
A number of countries have data points for 1948 and 1949. In all instances, this data is sourced from an early publication from the UN FAO (1949).
Full citation: FAO (1949) – The state of food and agriculture, 1949 – a survey of world conditions and prospects. The State of Food and Agriculture, 1949. Available here.
1961 onwards: UN Food and Agriculture Organization
The data for all countries from the year 1961 onwards is sourced from the Food and Agriculture Organization of the United Nations.
The UN FAO publishes a large database of food, nutrition and agricultural metrics for every country in the world. These datasets begin in the year 1961.
It publishes a metric ‘Food supply per capita (kcal/capita/day)’ – below I describe what this means in more detail – which is used here.
Notes on this data: data from 1961 to 1991 for Post-Soviet states are assumed to be in line with reported data for the USSR over this period.
Data for the USSR is determined to be highly uncertain, and likely represents an overestimate of caloric supply prior to its dissolution. The UN FAO admits its estimates of USSR availability are highly uncertain, and comparative sources suggest the same. You can find detailed discussion on this topic, published by José Luis Ricón (Artir), available here.
Full citation: Food and Agriculture Organization of the United Nations (FAO)
What is daily calorie supply and how is it measured?
Calorie supply measures the amount of dietary energy that is available for people to eat. It is measured in kilocalories per person per day. It is measured as an average across the total population.
This does not necessarily equate to the amount of kilocalories that people consume on a daily basis. To estimate this we would need highly detailed food diaries from household surveys, which is rarely available at a population level.
Instead, calorie supply measures the amount of calories available for consumption at the final stage of the supply chain: the retail or distribution level. This means actual consumption of calories will be calorie supply minus any consumer waste that occurs after retail. Actual consumption is therefore lower than calorie supply.
How do researchers estimate these figures? The UN FAO provides detailed accounts of food production across all countries – broken down by crop and product type – in addition to ‘balance sheets’ of where this food goes. These accounts detail food losses; animal feed; allocation to biofuels; exports and imports etc.
After we take account of all of these flows of products we arrive at a final figure of how much reaches the consumer level. This is the daily supply of calories.
Historical sources estimate these figures in a similar way. They have accounts of total production of different foods. Using estimates of how this is distributed, they can calculate an equivalent measure of how much is available for final consumption.


